


The Investorlift Dashboard, located in the admin panel, provides a clear, visual overview of activity, buyers, and email performance. By consolidating critical metrics into a single view, it enables investors to monitor, analyze, and optimize their operations effectively.
This guide explains each dashboard section, the available filters, and what each metric means in detail.
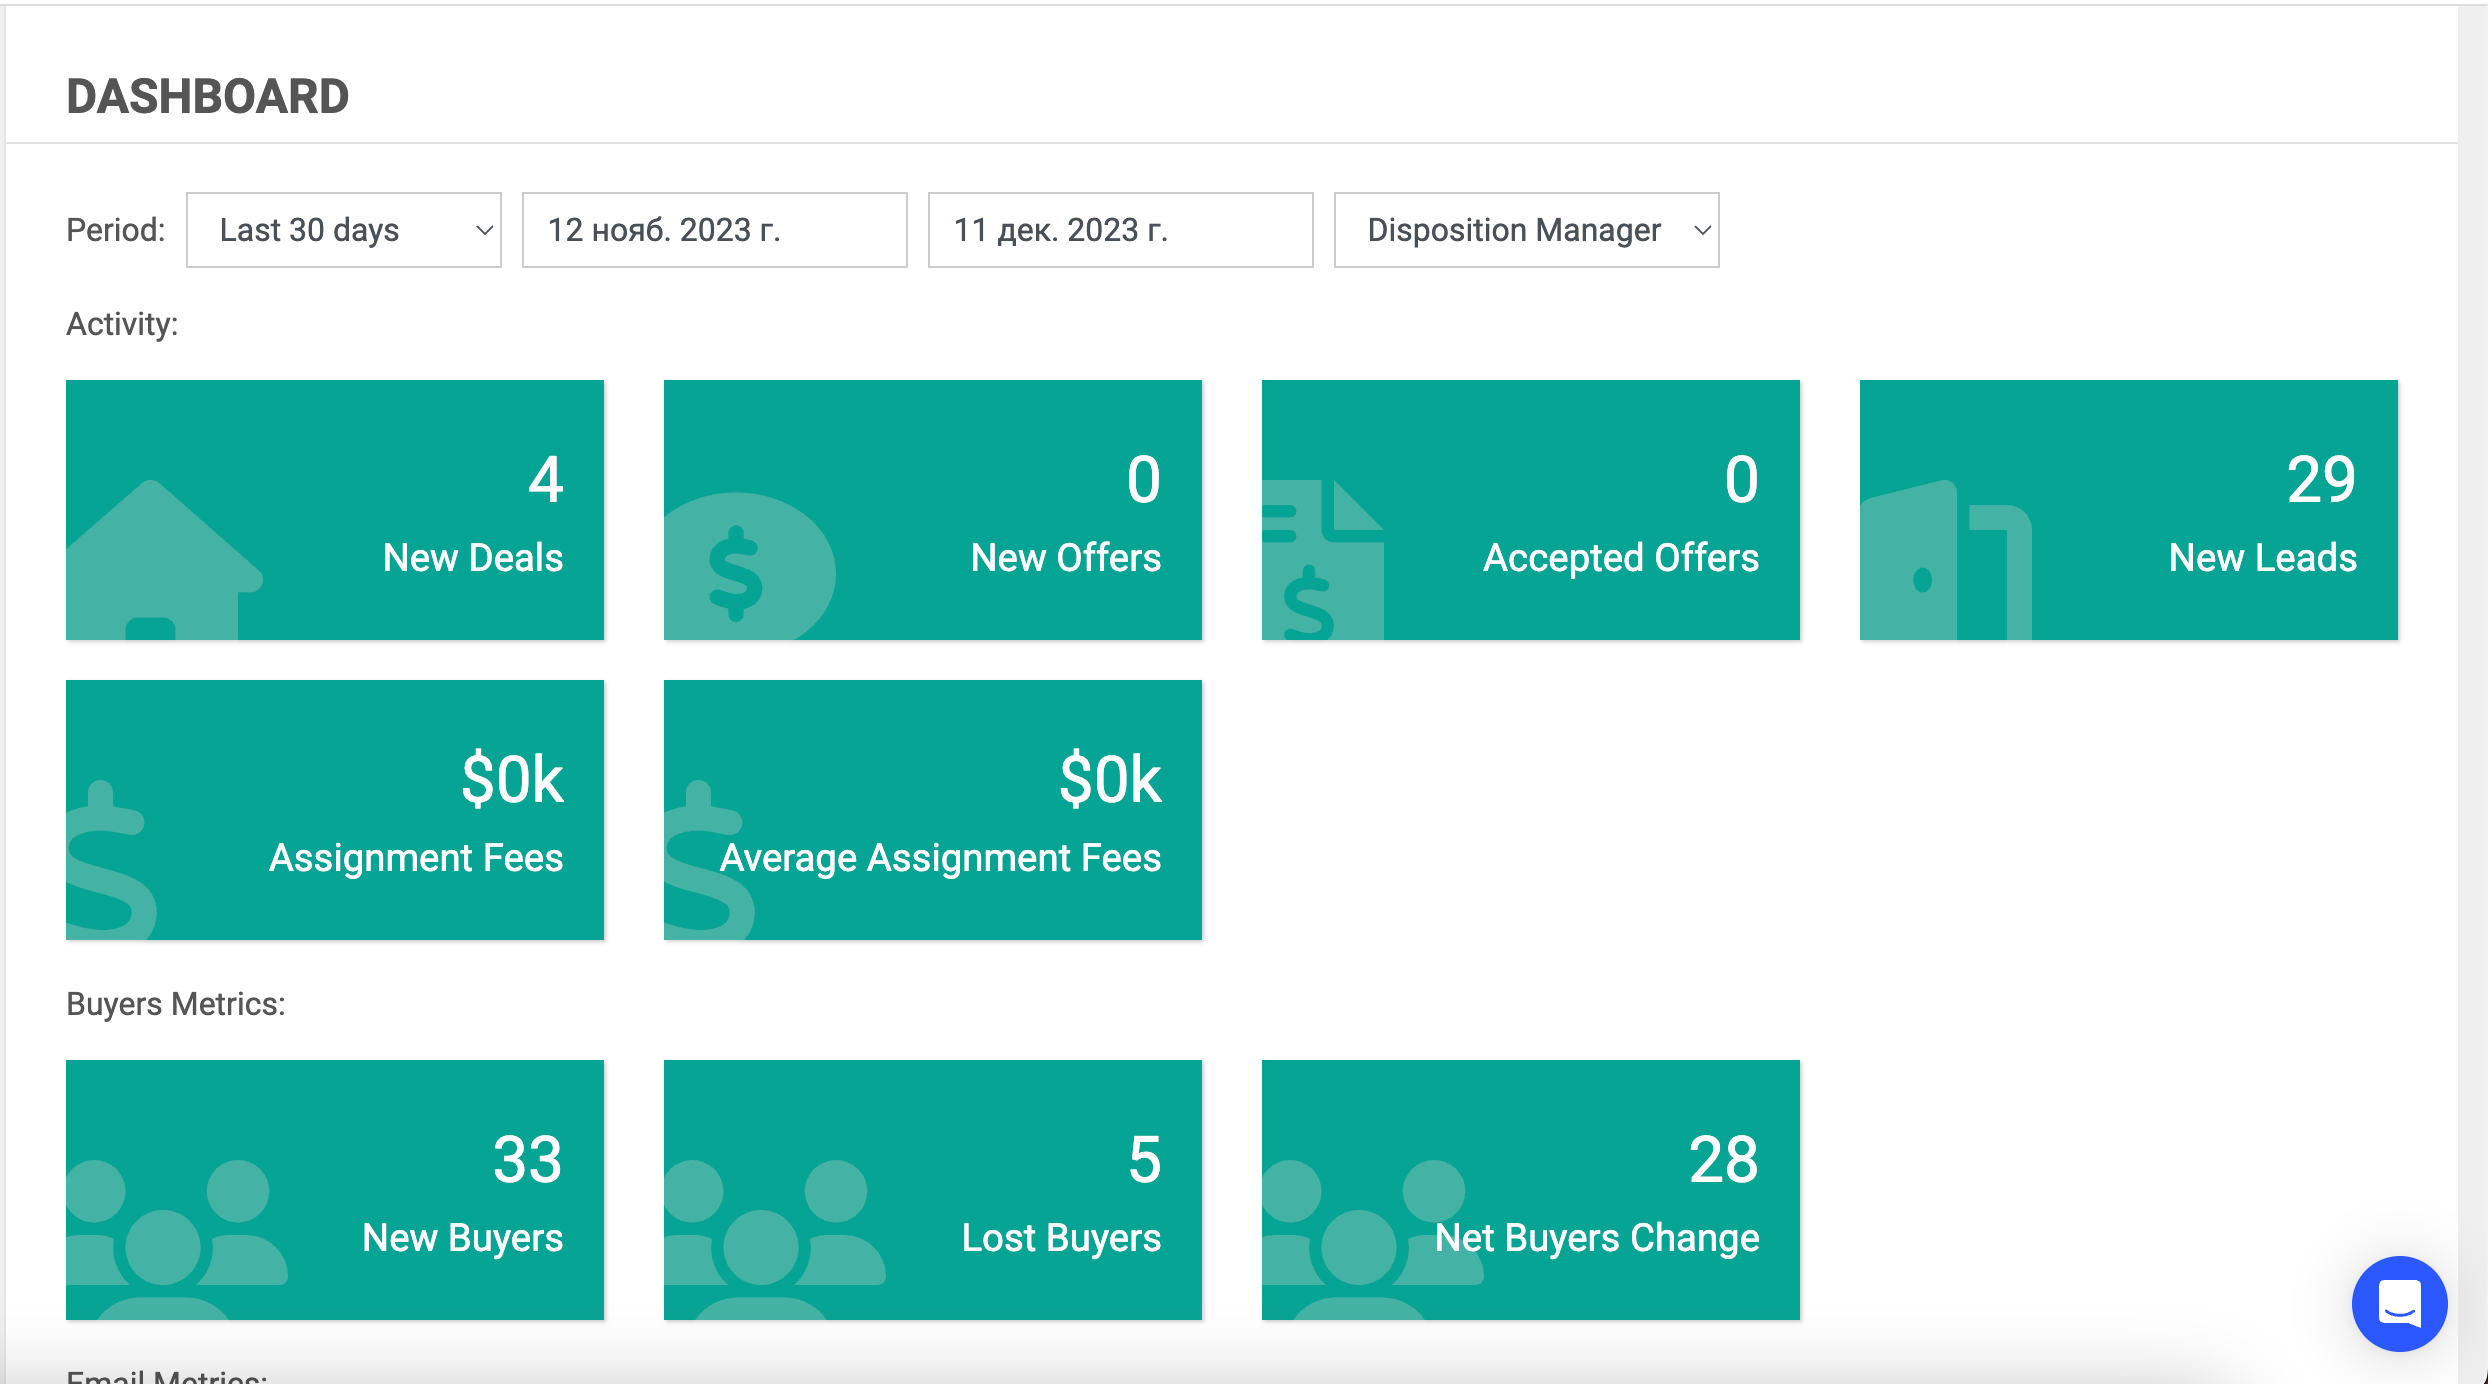
Dashboard Sections
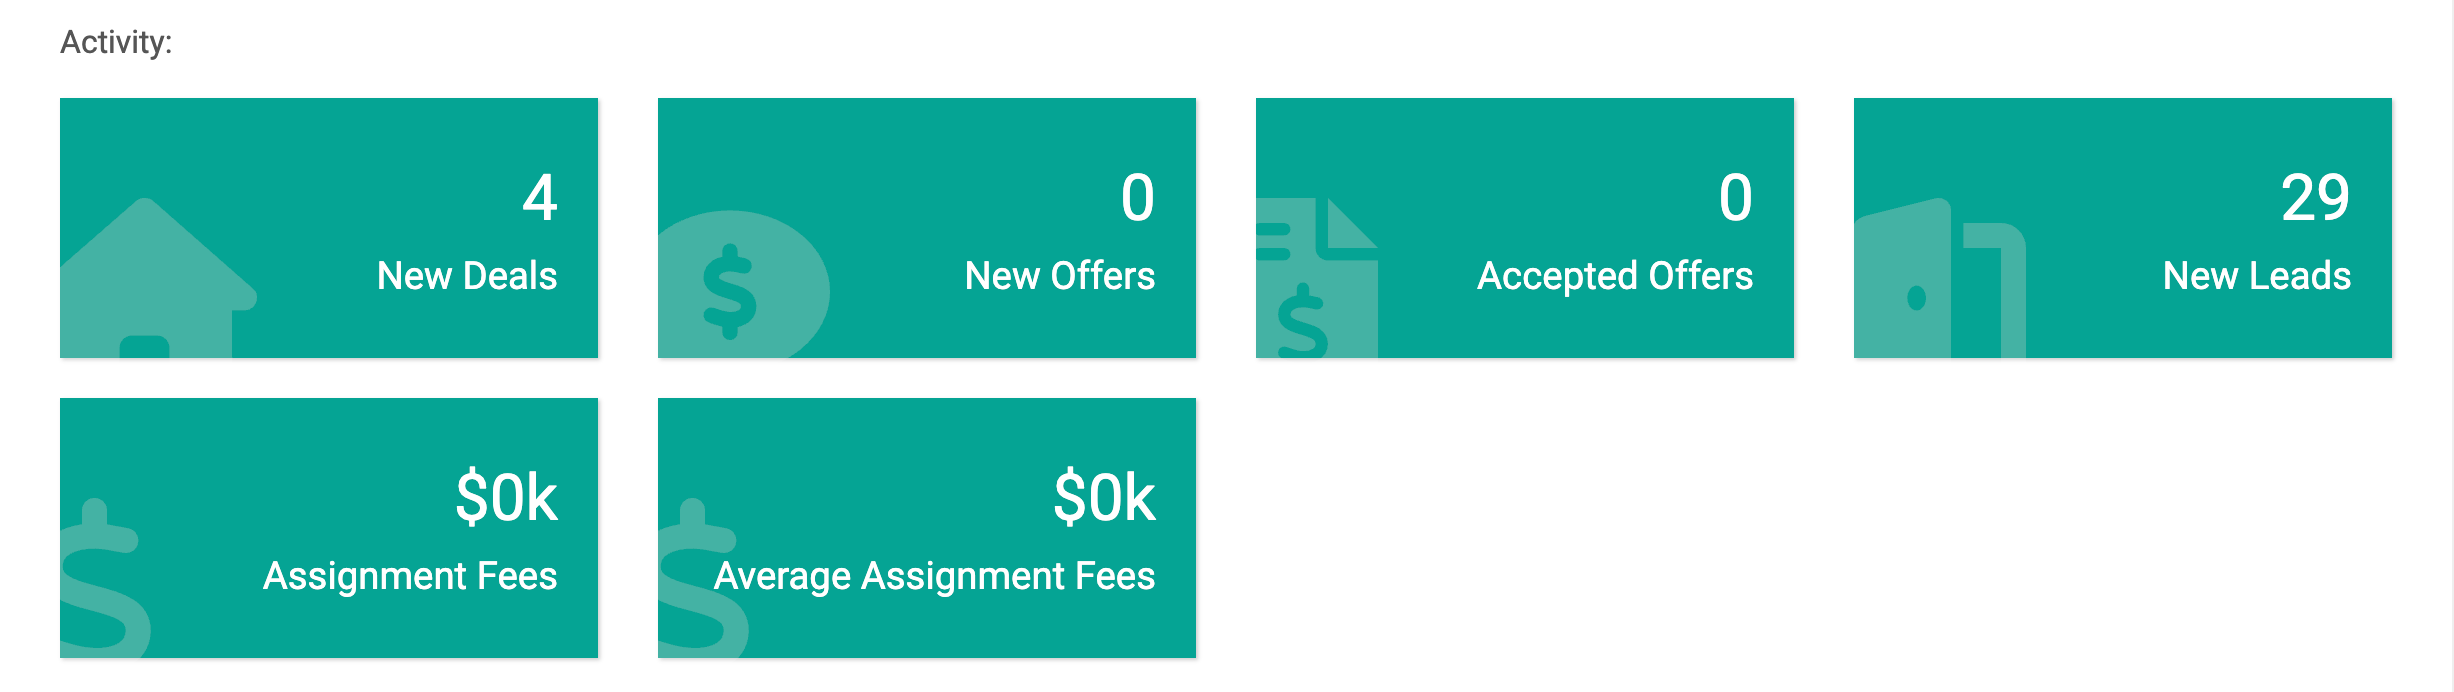
- The Activity section summarizes deal and offer performance over a selected time period.
- New Deals: The total number of new property deals added during the selected period.
- New Offers: The number of offers received from buyers on listed deals.
- Accepted Offers: How many offers were formally accepted.
- New Leads: New potential buyers generated (e.g., through campaigns or inbound requests).
- Assignment Fees: Total dollar value of assignment fees earned during the period.
- Average Assignment Fees: The average value of assignment fees per transaction.
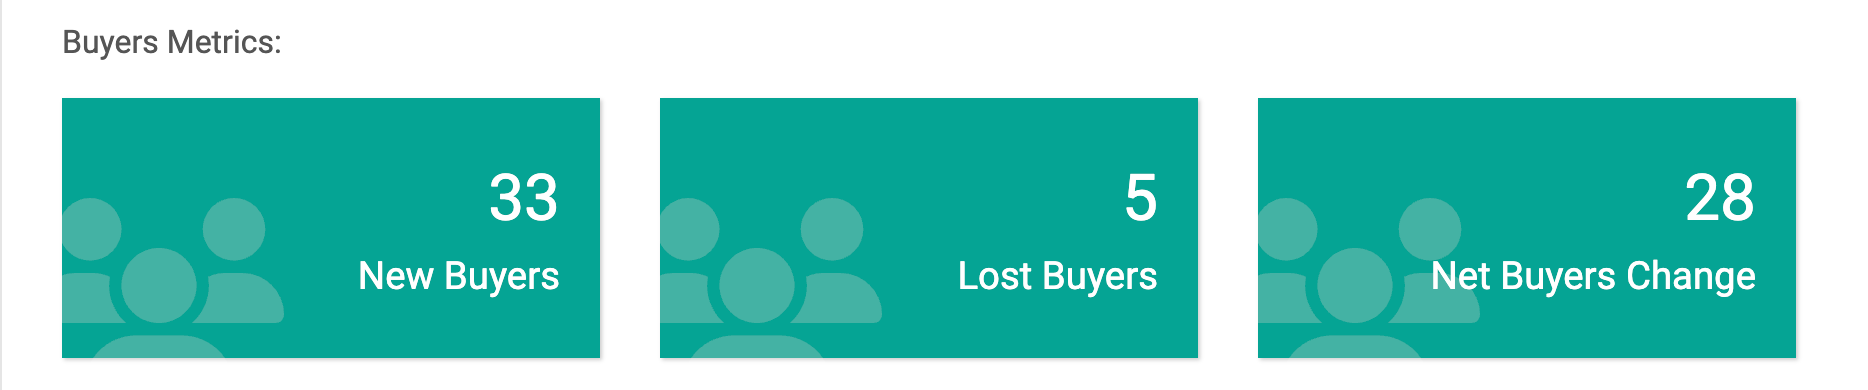
- The Buyers Metrics section highlights changes in your buyer network.
- New Buyers: Number of new buyers who engaged with your deals or were added to your list.
- Lost Buyers: Buyers who unsubscribed or became inactive during the period.
- Net Buyers Change: The net difference between gained and lost buyers, showing overall growth or decline.
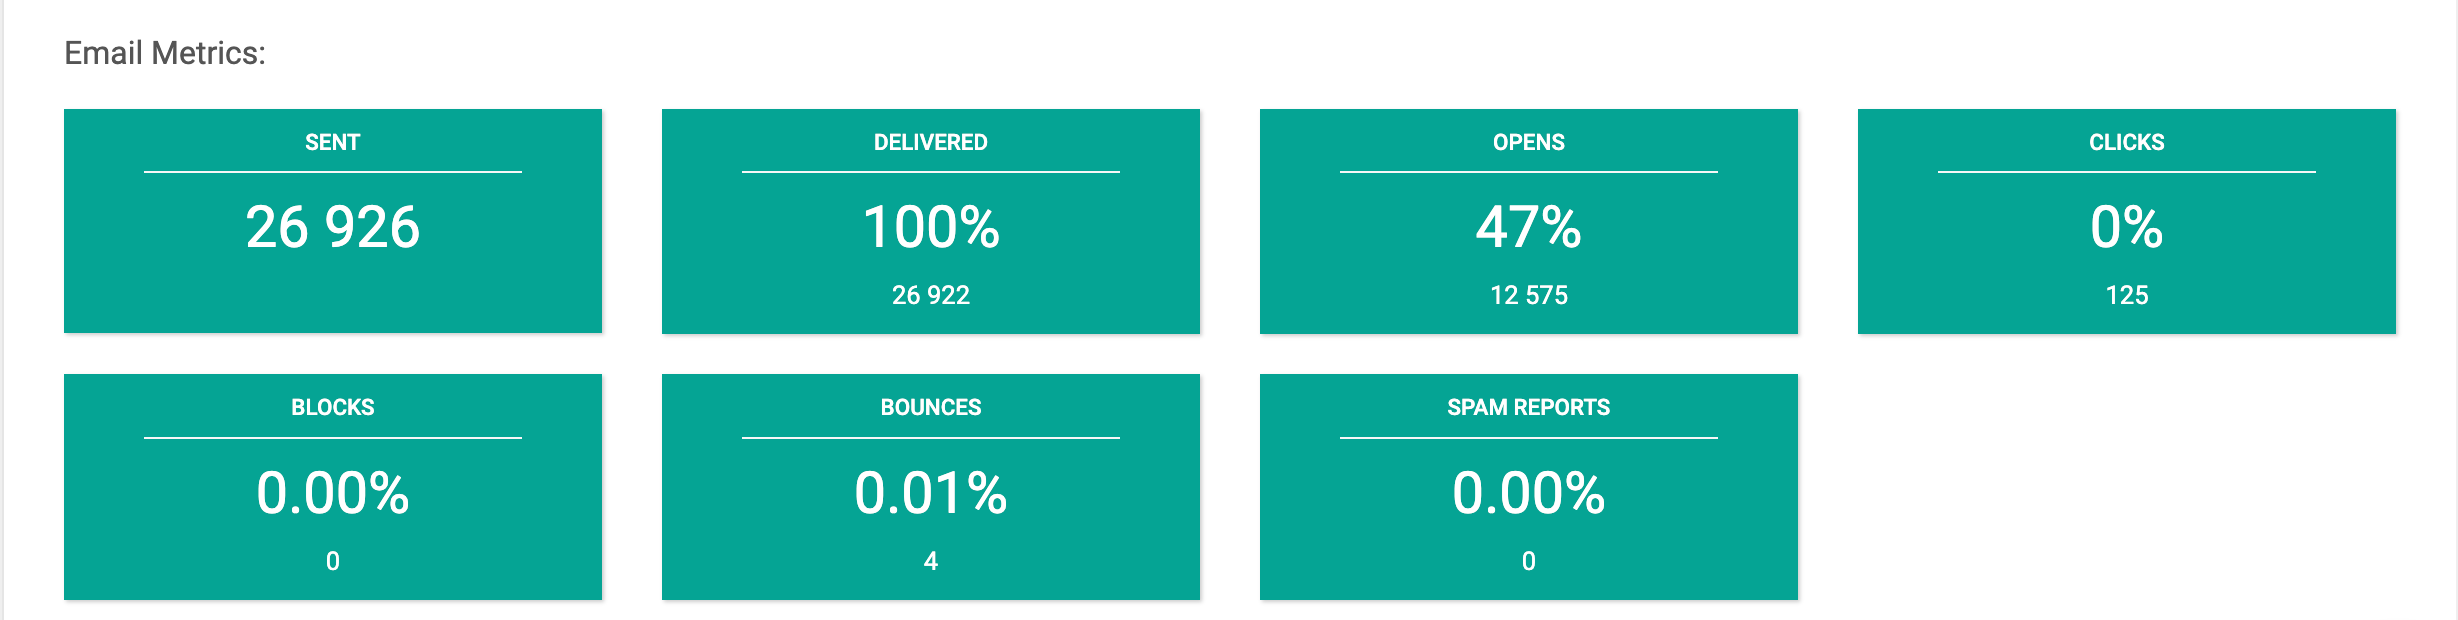
- The Email Metrics section provides detailed insights into campaign performance.
- Sent: The total number of emails sent.
- Delivered: Percentage and count of emails successfully delivered.
- Opens: Percentage and count of emails opened by recipients.
- Clicks: Number of recipients who clicked on links in the email.
- Blocks: Percentage of emails blocked by recipients.
- Bounces: Percentage of emails that could not be delivered (e.g., invalid addresses).
- Spam Reports: Percentage of recipients marking your email as spam.
For a more detailed understanding of email metrics, refer to this article
Filters
Filters allow you to adjust the dashboard to display data that best fits your analysis needs.
-
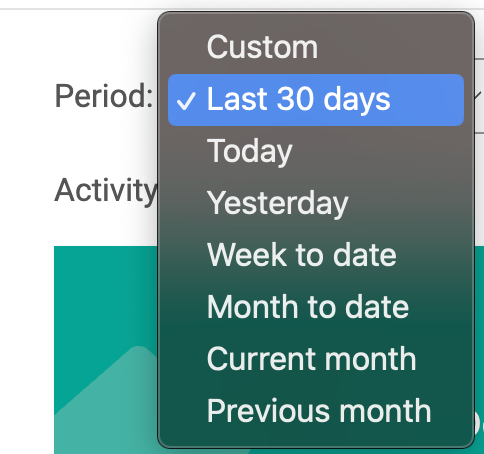
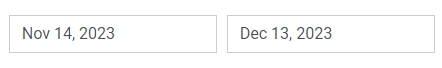
Period: Choose from preset ranges such as Last 30 days, Today, Yesterday, Week to Date, Month to Date, Current Month, or Previous Month. You can also enter custom date ranges.

- Disposition Manager: Filter results by specific team members. Selecting a name from the dropdown shows only the activity managed by that individual.

This streamlined view empowers better decision-making and more efficient deal management.
Contact Support
If you still have questions or encounter issues, we're here to help.
Contact Us:
-
Wholesaler Support (email): support@investorlift.com
-
Live Chat: Available in your bottom-right corner
🗣Your feedback is valuable to us! Scroll down and let us know if this content was helpful to you. Every rating helps us make our Help Center better for you.