
In this guide, we’ll break down the essential components of the God Mode interface, focusing on key terms, filters, and visual elements that help you analyze properties and buyers effectively.
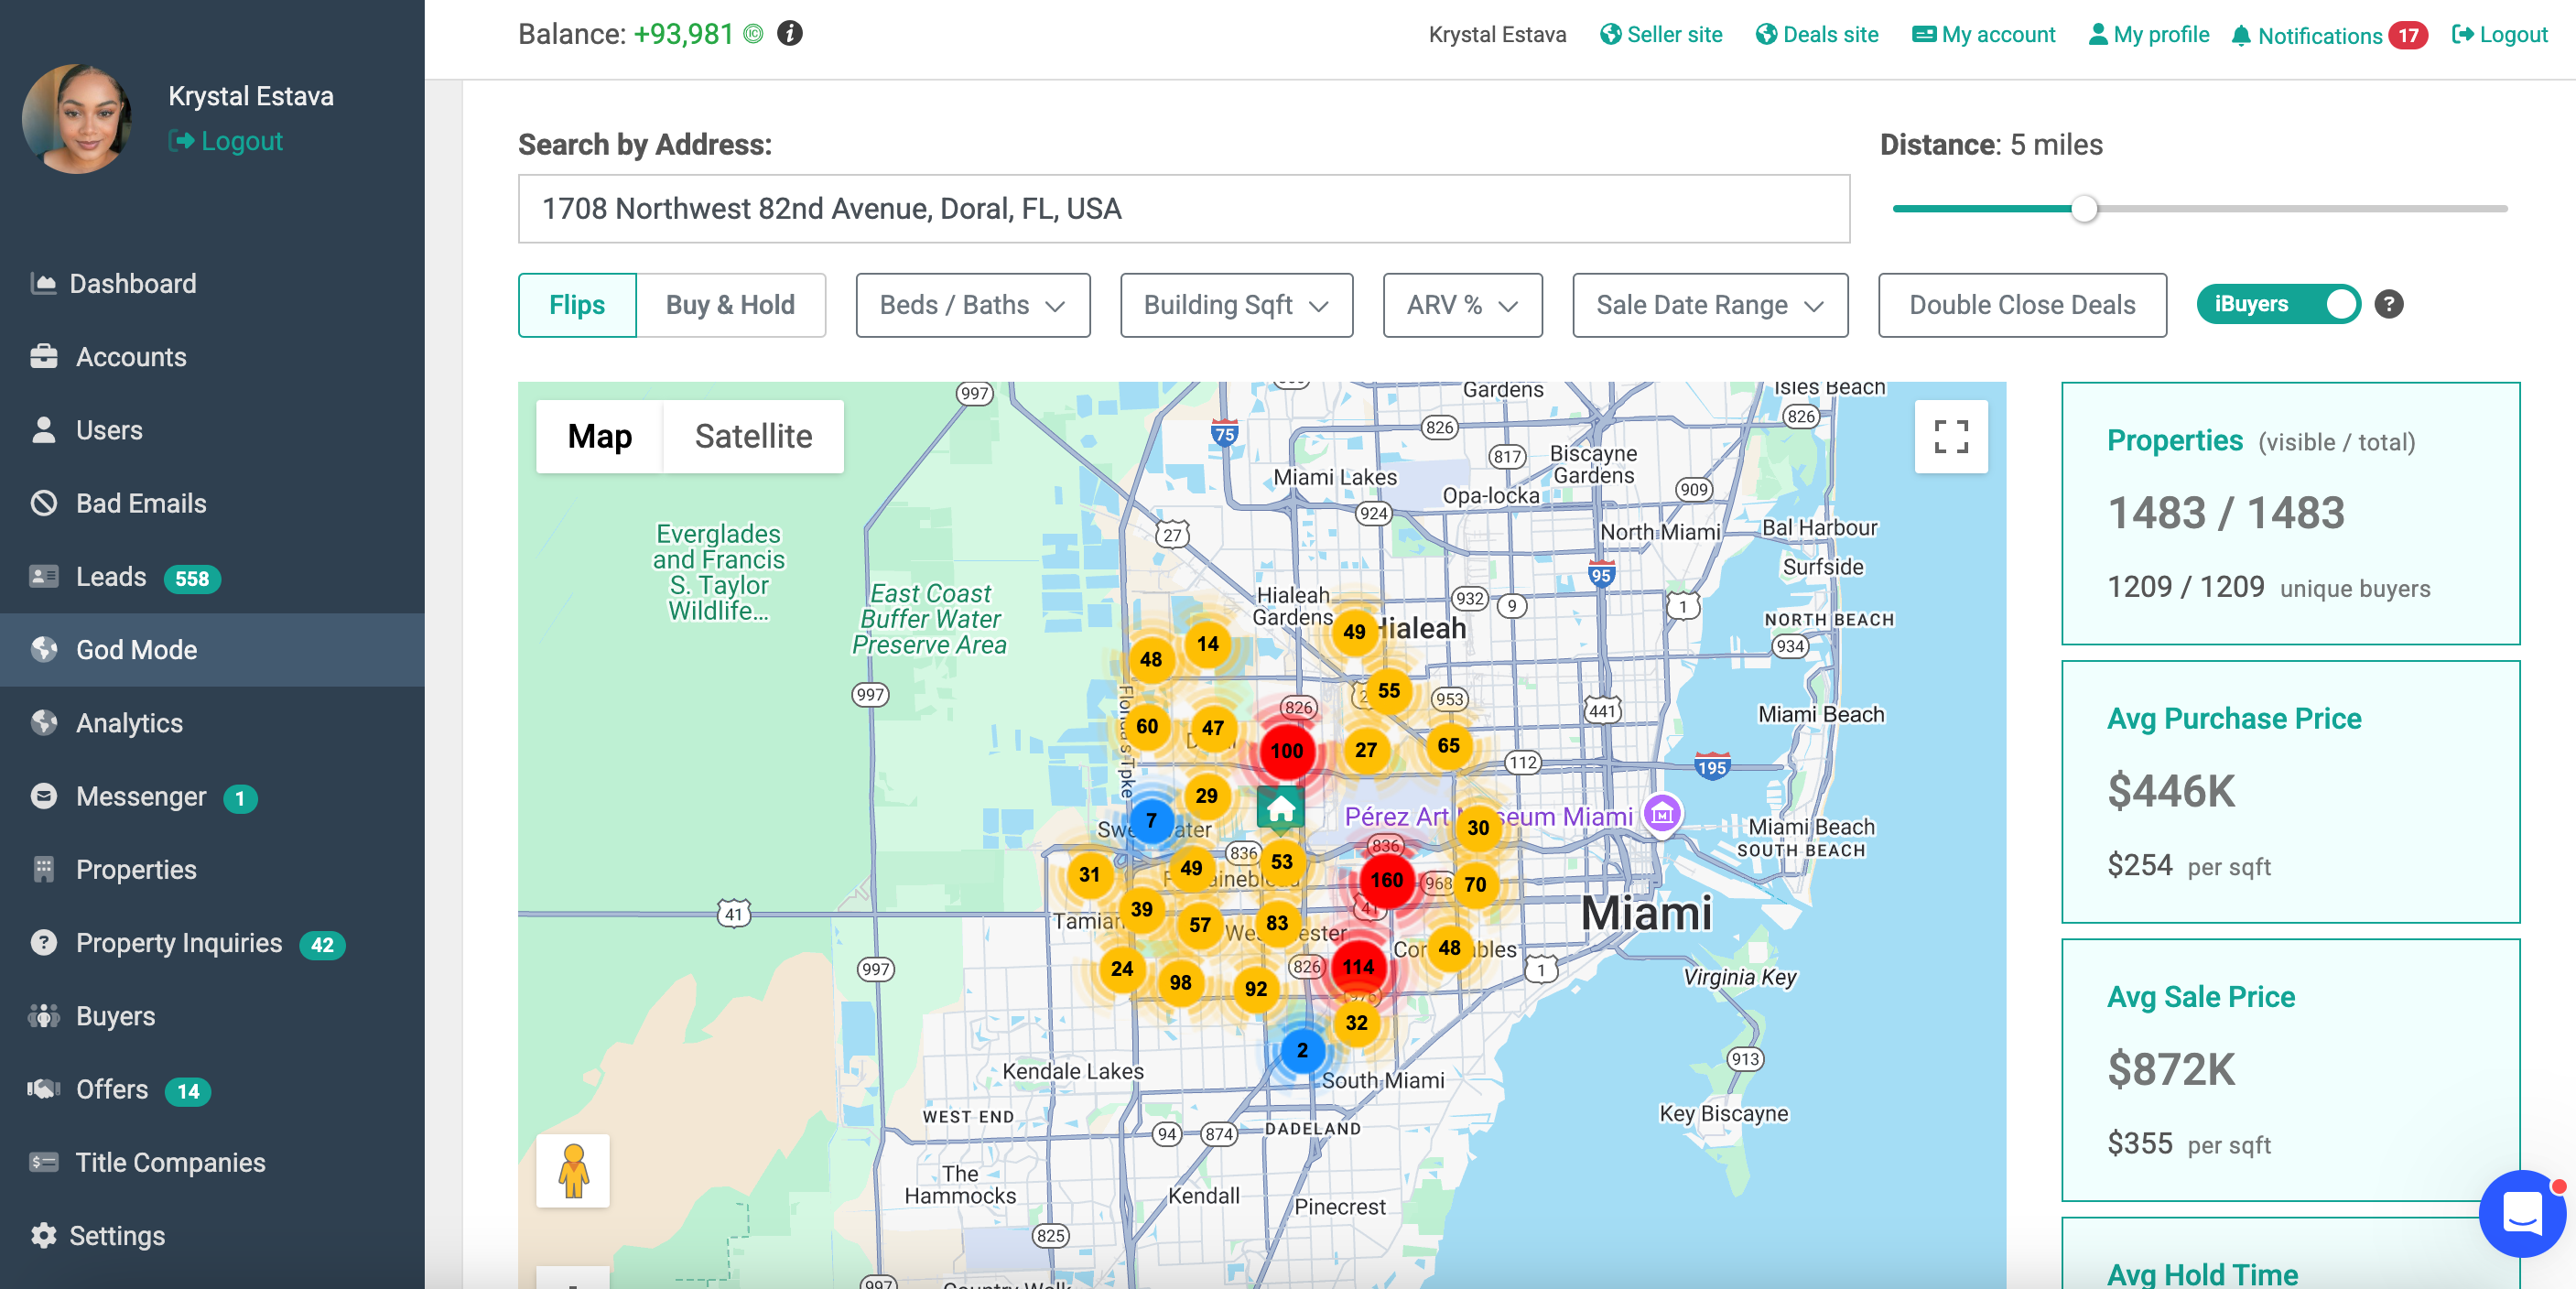
Colors on the Map:
- Blue Dots: Areas where 1–10 properties were sold.
- Yellow Dots: Areas where 10–100 properties were sold.
- Red Dots: Areas where more than 100 properties were sold.
- Green Icon (House): Current location or selected property.
Terms Explained:
-
Flips:
Refers to properties that are purchased, renovated, and quickly resold for profit. This strategy focuses on increasing property value through repairs or upgrades and selling within a short timeframe. -
Buy and Hold:
A long-term investment strategy where a property is purchased and retained, typically for rental income or future appreciation in value. -
Bed/Bath:
A filter used to specify the number of bedrooms and bathrooms in the properties being analyzed. -
Building Sqft:
Refers to the total square footage of the building or property structure. This metric is used to compare property sizes. -
ARV% (After Repair Value Percentage):
The estimated value of a property after renovations are completed, expressed as a percentage. It helps investors assess the profitability of a property flip. -
Sale Date Range:
A filter that allows users to analyze properties based on their sale dates within a specific timeframe. -
Double Closed Deals:
Transactions where an investor purchases and sells a property on the same day, often to avoid using their own funds or taking ownership for an extended period. -
iBuyers:
Institutional buyers or companies that use technology to make instant cash offers on homes. Examples include Opendoor and Zillow Offers.
 Your feedback is valuable to us! Scroll down and let us know if this content was helpful to you. Every rating helps us make our Help Center better for you.